- Published on
OpenSearch Dashboards for Logs - Integrating with Fluent Bit
- Authors
We have a Kubernetes cluster running a varied set of applications and utilities, which is hosted on Linode. For a long time we've been trying to find a good solution for logs which doesn't involve a lot of overhead and fits with our current infrastructure. We did look at Loki, but it would involve a totally new stack and we wanted to avoid that.
Our Setup:
- Kubernetes cluster on Linode
- Fluent Bit for log collection (currently just exporting to S3 for archive purposes)
- OpenSearch already running for search engine purposes
- Diverse APIs and applications generating logs
- Need for a simple, efficient log management solution without adding new tools
So we decided to integrate Fluent Bit with OpenSearch and use OpenSearch Dashboards for visualization. This way, we can leverage our existing infrastructure and avoid the overhead of introducing new tools.
Step 1: Configure Fluent Bit to Send Logs to OpenSearch
First, we need to configure Fluent Bit to send logs to OpenSearch. We can do this by adding an output configuration in Fluent Bit's configuration file. Here's an example of how to set it up:
apiVersion: v1
kind: ConfigMap
metadata:
  name: fluent-bit-config
  namespace: logging
data:
  fluent-bit.conf: |
    [SERVICE]
        Flush        10
        Log_Level    Info
        Daemon       off
        Parsers_File parsers.conf
        HTTP_Server  Off
        storage.path /var/log/flb-storage/


    [INPUT]
        Name                tail
        Path                /var/log/containers/*.log
        Exclude_Path        /var/log/containers/*_kube-system_*.log,/var/log/containers/*_logging_*.log,/var/log/containers/*opensearch-dashboards*.log,/var/log/containers/*opensearch*.log
        Refresh_Interval    5
        Rotate_Wait         30
        Mem_Buf_Limit       50MB
        Skip_Long_Lines     On
        DB                  /var/log/flb_kube.db
        Tag                 kube.*
        storage.type        filesystem

    [FILTER]
        Name                kubernetes
        Match               kube.*
        Kube_URL            https://kubernetes.default.svc:443
        Kube_CA_File        /var/run/secrets/kubernetes.io/serviceaccount/ca.crt
        Kube_Token_File     /var/run/secrets/kubernetes.io/serviceaccount/token
        Kube_Tag_Prefix     kube.var.log.containers.
        Merge_Log           On
        Keep_Log            Off
        Labels              On
        Annotations         On

    [FILTER]
        Name    grep
        Match   kube.*
        Exclude kubernetes.pod_name opensearch-dashboards

    [FILTER]
        Name    grep
        Match   kube.*
        Exclude kubernetes.pod_name opensearch

    [FILTER]
        Name    grep
        Match   kube.*
        Exclude kubernetes.namespace_name logging

    [FILTER]
        Name    grep
        Match   kube.*
        Exclude kubernetes.namespace_name kube-system

    [FILTER]
        Name    grep
        Match   kube.*
        Exclude kubernetes.namespace_name monitoring

    [FILTER]
        Name    grep
        Match   kube.*
        Exclude log (?i)\.(png|jpg|jpeg|gif|svg|ico|css|js|woff|woff2|ttf|eot|otf|map|webp|avif)

    [FILTER]
        Name    grep
        Match   kube.*
        Exclude log (?i)(GET|POST|PUT|DELETE|PATCH|HEAD|OPTIONS).*(\.png|\.jpg|\.jpeg|\.gif|\.svg|\.ico|\.css|\.js|\.woff|\.woff2|\.ttf|\.eot|\.otf|\.map|\.webp|\.avif)

    [FILTER]
        Name    grep
        Match   kube.*
        Exclude log (?i)(404|403).*(\.png|\.jpg|\.jpeg|\.gif|\.svg|\.ico|\.css|\.js|\.woff|\.woff2|\.ttf|\.eot|\.otf|\.map|\.webp|\.avif)

    [FILTER]
        Name    grep
        Match   kube.*
        Exclude log \s(200|201|202|204|206|301|302|303|304|307|308)\s

    [FILTER]
        Name    grep
        Match   kube.*
        Regex   log (?i)(error|failed|exception)

    # Add this filter to exclude PostgreSQL checkpoint logs
    [FILTER]
        Name    grep
        Match   kube.*postgres*
        Exclude log (?i)checkpoint

    # Add this filter to exclude PostgreSQL info level logs
    [FILTER]
        Name    grep
        Match   kube.*postgres*
        Exclude log "level":"info"

    [OUTPUT]
        Name                opensearch
        Match               *
        Host                `<OPENSEARCH_HOST>`
        Port                9200
        Index               fluent-bit
        Logstash_Format     On
        Logstash_Prefix     fluent-bit
        Retry_Limit         5
        Suppress_Type_Name  On
        net.keepalive       On
        net.keepalive_idle_timeout 30
        net.connect_timeout 10
        net.connect_timeout_log_error Off
        Workers             1
        Replace_Dots        On

  parsers.conf: |
    [PARSER]
        Name        apache
        Format      regex
        Regex       ^(?<host>[^ ]*) (?<ident>[^ ]*) (?<user>[^ ]*) \[(?<time>[^\]]*)\] "(?<request>[^"]*)" (?<code>\d{3}) (?<size>\d+|-) "(?<referer>[^"]*)" "(?<agent>[^"]*)"
        Time_Key    time
        Time_Format %d/%b/%Y:%H:%M:%S %z

    [PARSER]
        Name        nginx
        Format      regex
        Regex       ^(?<remote>[^ ]*) - (?<user>[^ ]*) \[(?<time>[^\]]*)\] "(?<request>[^"]*)" (?<code>\d{3}) (?<size>\d+) "(?<referer>[^"]*)" "(?<agent>[^"]*)"
        Time_Key    time
        Time_Format %d/%b/%Y:%H:%M:%S %z

    [PARSER]
        Name        cri
        Format      regex
        Regex       ^(?<time>.+?) (?<stream>stdout|stderr) (?<log>.*)$
        Time_Key    time
        Time_Format %Y-%m-%dT%H:%M:%S.%L%z
        Time_Keep   On
Make sure to replace <OPENSEARCH_HOST> with the actual hostname or IP address of your OpenSearch instance. This configuration will allow Fluent Bit to collect logs from the specified path, filter out unnecessary logs, and send the relevant logs to OpenSearch for indexing. It filters out logs from the kube-system, logging, opensearch-dashboards, and opensearch namespaces, as well as logs from the opensearch-dashboards and opensearch pods. It also excludes logs that match certain patterns (e.g., static assets, successful HTTP responses) and includes only logs that contain keywords like "error", "failed", or "exception". Additionally, it filters out PostgreSQL checkpoint logs and info level logs to focus on more relevant error logs.
Step 2: Set Up OpenSearch Dashboards
Next, we need to set up OpenSearch Dashboards to visualize the logs. We can create an index pattern in OpenSearch Dashboards that matches the index we specified in Fluent Bit (e.g., fluentbit-logs*). This will allow us to explore the logs and create visualizations based on the data.
Create Dashboards Pods
To create the OpenSearch Dashboards pods, we can use the following Kubernetes manifest:
---
apiVersion: apps/v1
kind: Deployment
metadata:
  name: opensearch-dashboards
  labels:
    app: opensearch-dashboards
spec:
  replicas: 1
  selector:
    matchLabels:
      app: opensearch-dashboards
  template:
    metadata:
      labels:
        app: opensearch-dashboards
    spec:
      containers:
        - name: opensearch-dashboards
          image: opensearchproject/opensearch-dashboards:2.13.0
          ports:
            - containerPort: <PORT>
          env:
            - name: OPENSEARCH_HOSTS
              value: '<http://<OPENSEARCH_HOST>:9200>'
            - name: DISABLE_SECURITY_DASHBOARDS_PLUGIN
              value: "true"
          resources:
            requests:
              memory: "512Mi"
              cpu: "250m"
            limits:
              memory: "1Gi"
              cpu: "500m"
          readinessProbe:
            httpGet:
              path: /api/status
              port: 5601
            initialDelaySeconds: 30
            periodSeconds: 10

---
apiVersion: v1
kind: Service
metadata:
  name: opensearch-dashboards
  labels:
    app: opensearch-dashboards
spec:
  type: ClusterIP
  selector:
    app: opensearch-dashboards
  ports:
    - name: http
      port: <PORT>
      targetPort: <TARGET_PORT>
      protocol: TCP
Make sure to replace <OPENSEARCH_HOST> with the actual hostname or IP address of your OpenSearch instance. This manifest will create a deployment for OpenSearch Dashboards with the necessary environment variables to connect to OpenSearch.
*Note: The DISABLE_SECURITY_DASHBOARDS_PLUGIN environment variable is set to "true" to disable the security plugin in OpenSearch Dashboards, which is necessary if you are not using the security features of OpenSearch. If you are using the security features, you will need to configure the appropriate authentication and authorization settings.
Step 3: View Indexed Logs in OpenSearch Dashboards
Once Fluent Bit is configured and OpenSearch Dashboards is set up, you can access OpenSearch Dashboards through the service you created. You can then create visualizations and dashboards to analyze the logs collected by Fluent Bit. This will allow you to easily identify and troubleshoot errors in your applications.
Login to OpenSearch Dashboards
To log in to OpenSearch Dashboards, you can use the following command to port-forward the service to your local machine:
kubectl port-forward service/opensearch-dashboards <LOCAL_PORT>:<PORT> -n <NAMESPACE>
Make sure to replace <LOCAL_PORT>, <PORT>, and <NAMESPACE> with the appropriate values for your setup. Once you have port-forwarded the service, you can access OpenSearch Dashboards by navigating to http://localhost:<LOCAL_PORT> in your web browser.
Test Indexes Exist
fluentbit-logs*). This will allow you to explore the logs and create visualizations based on the data. See image below: 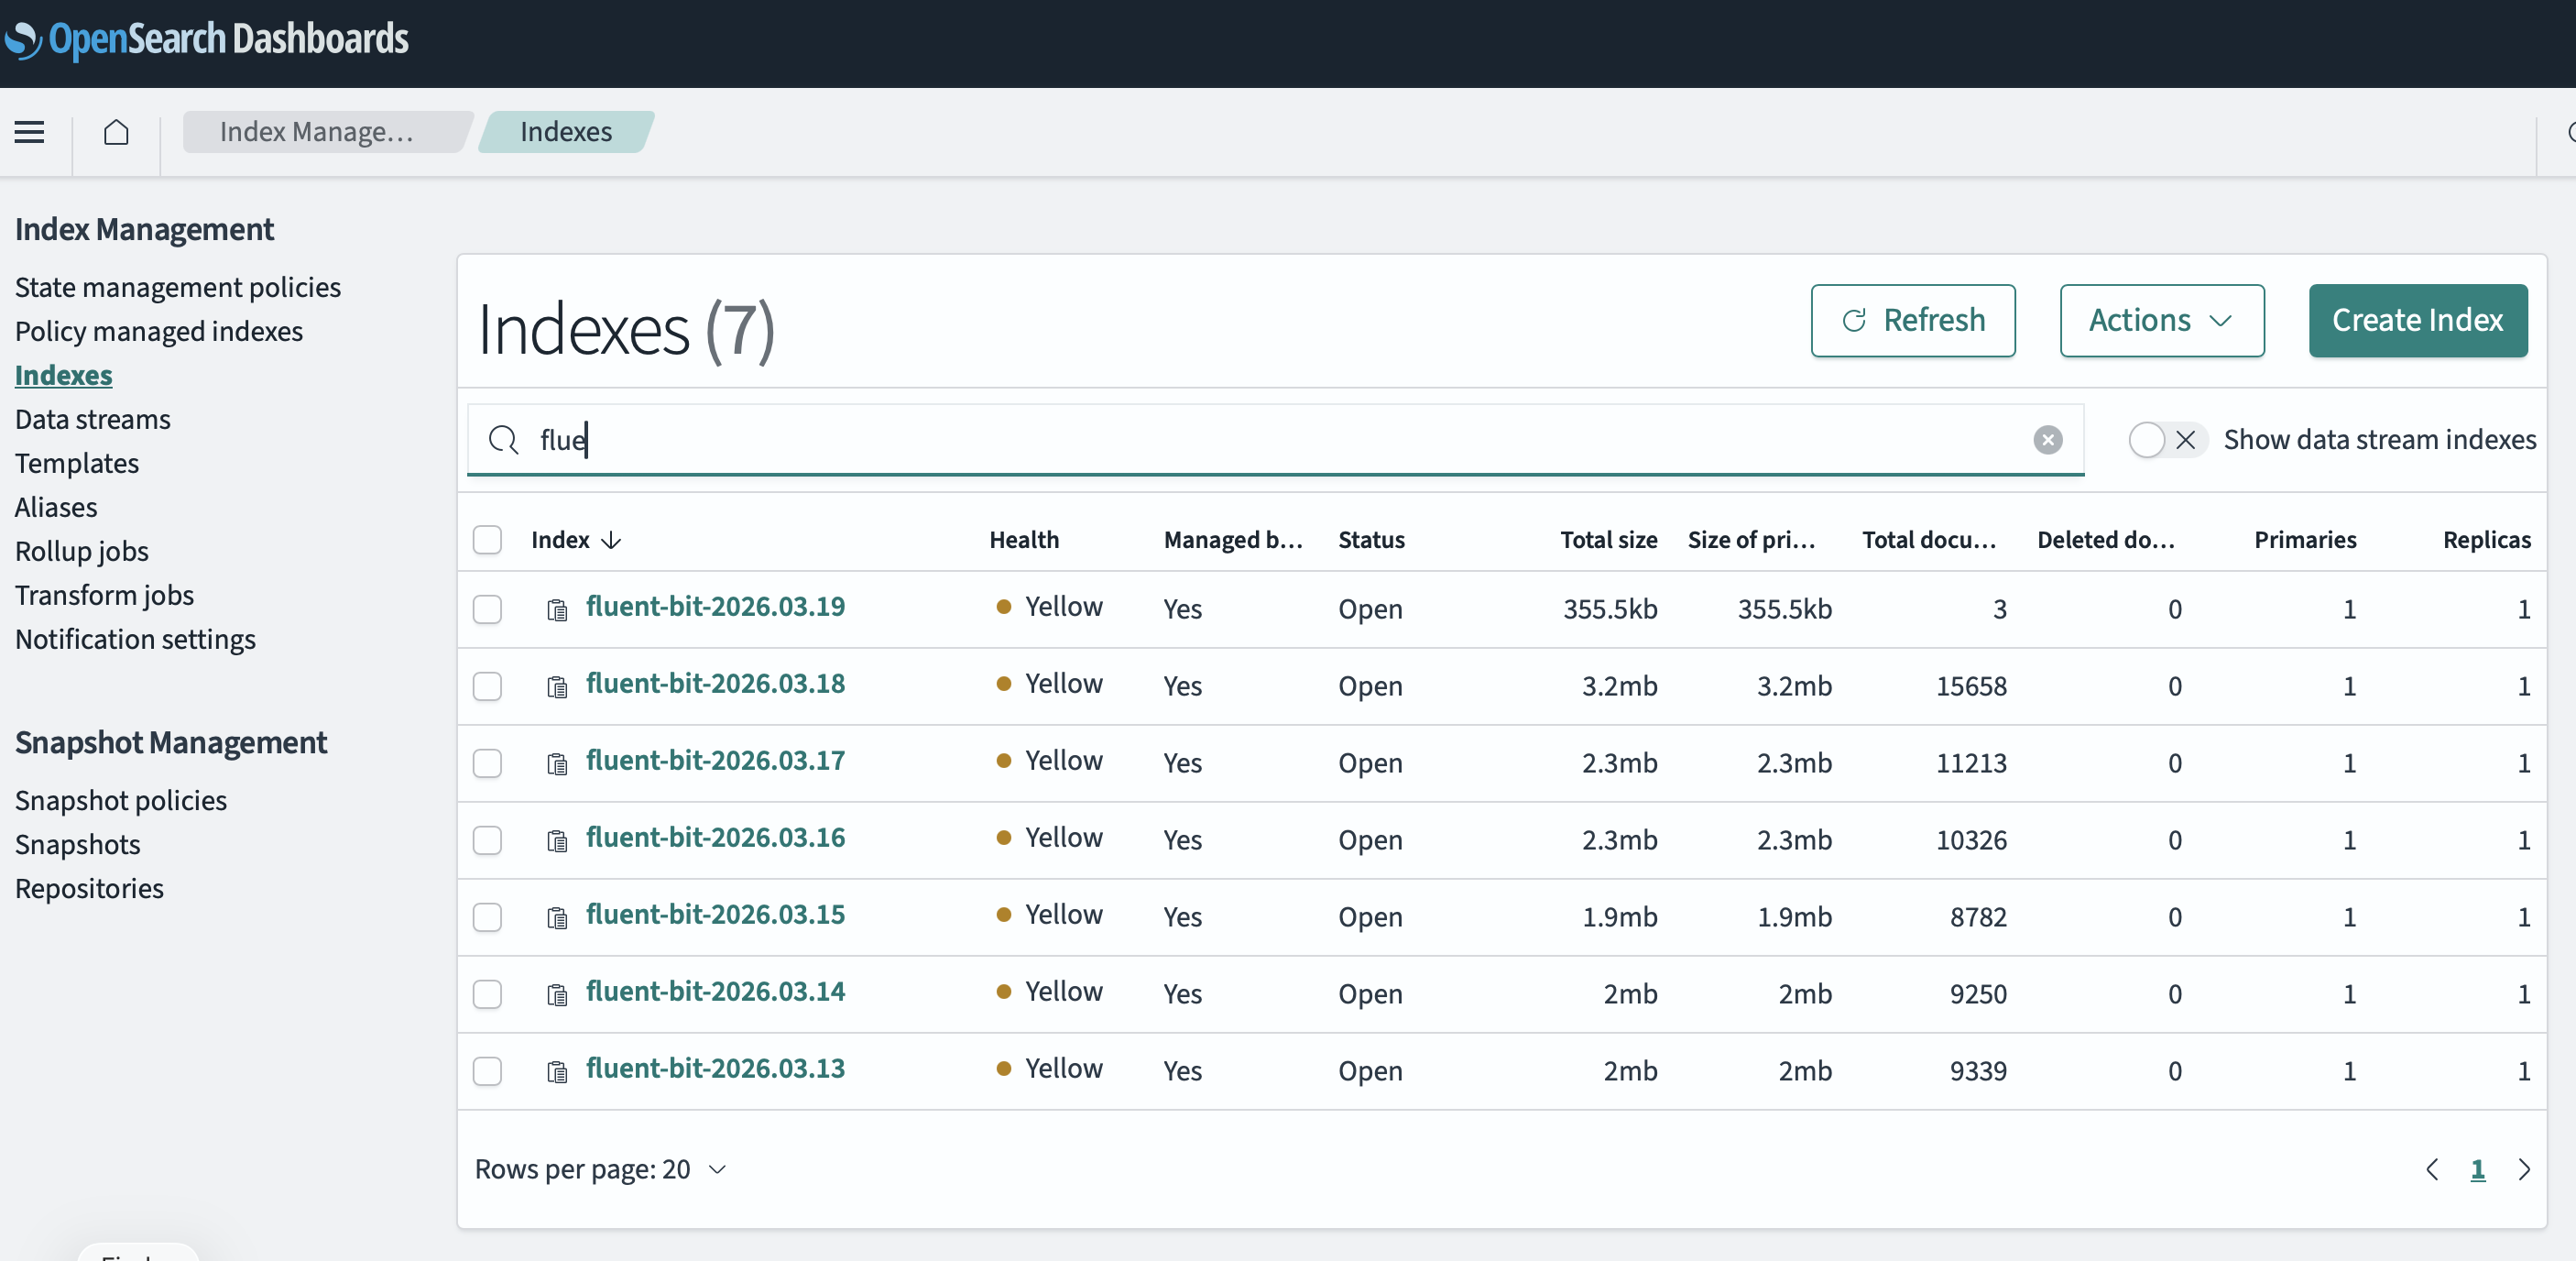
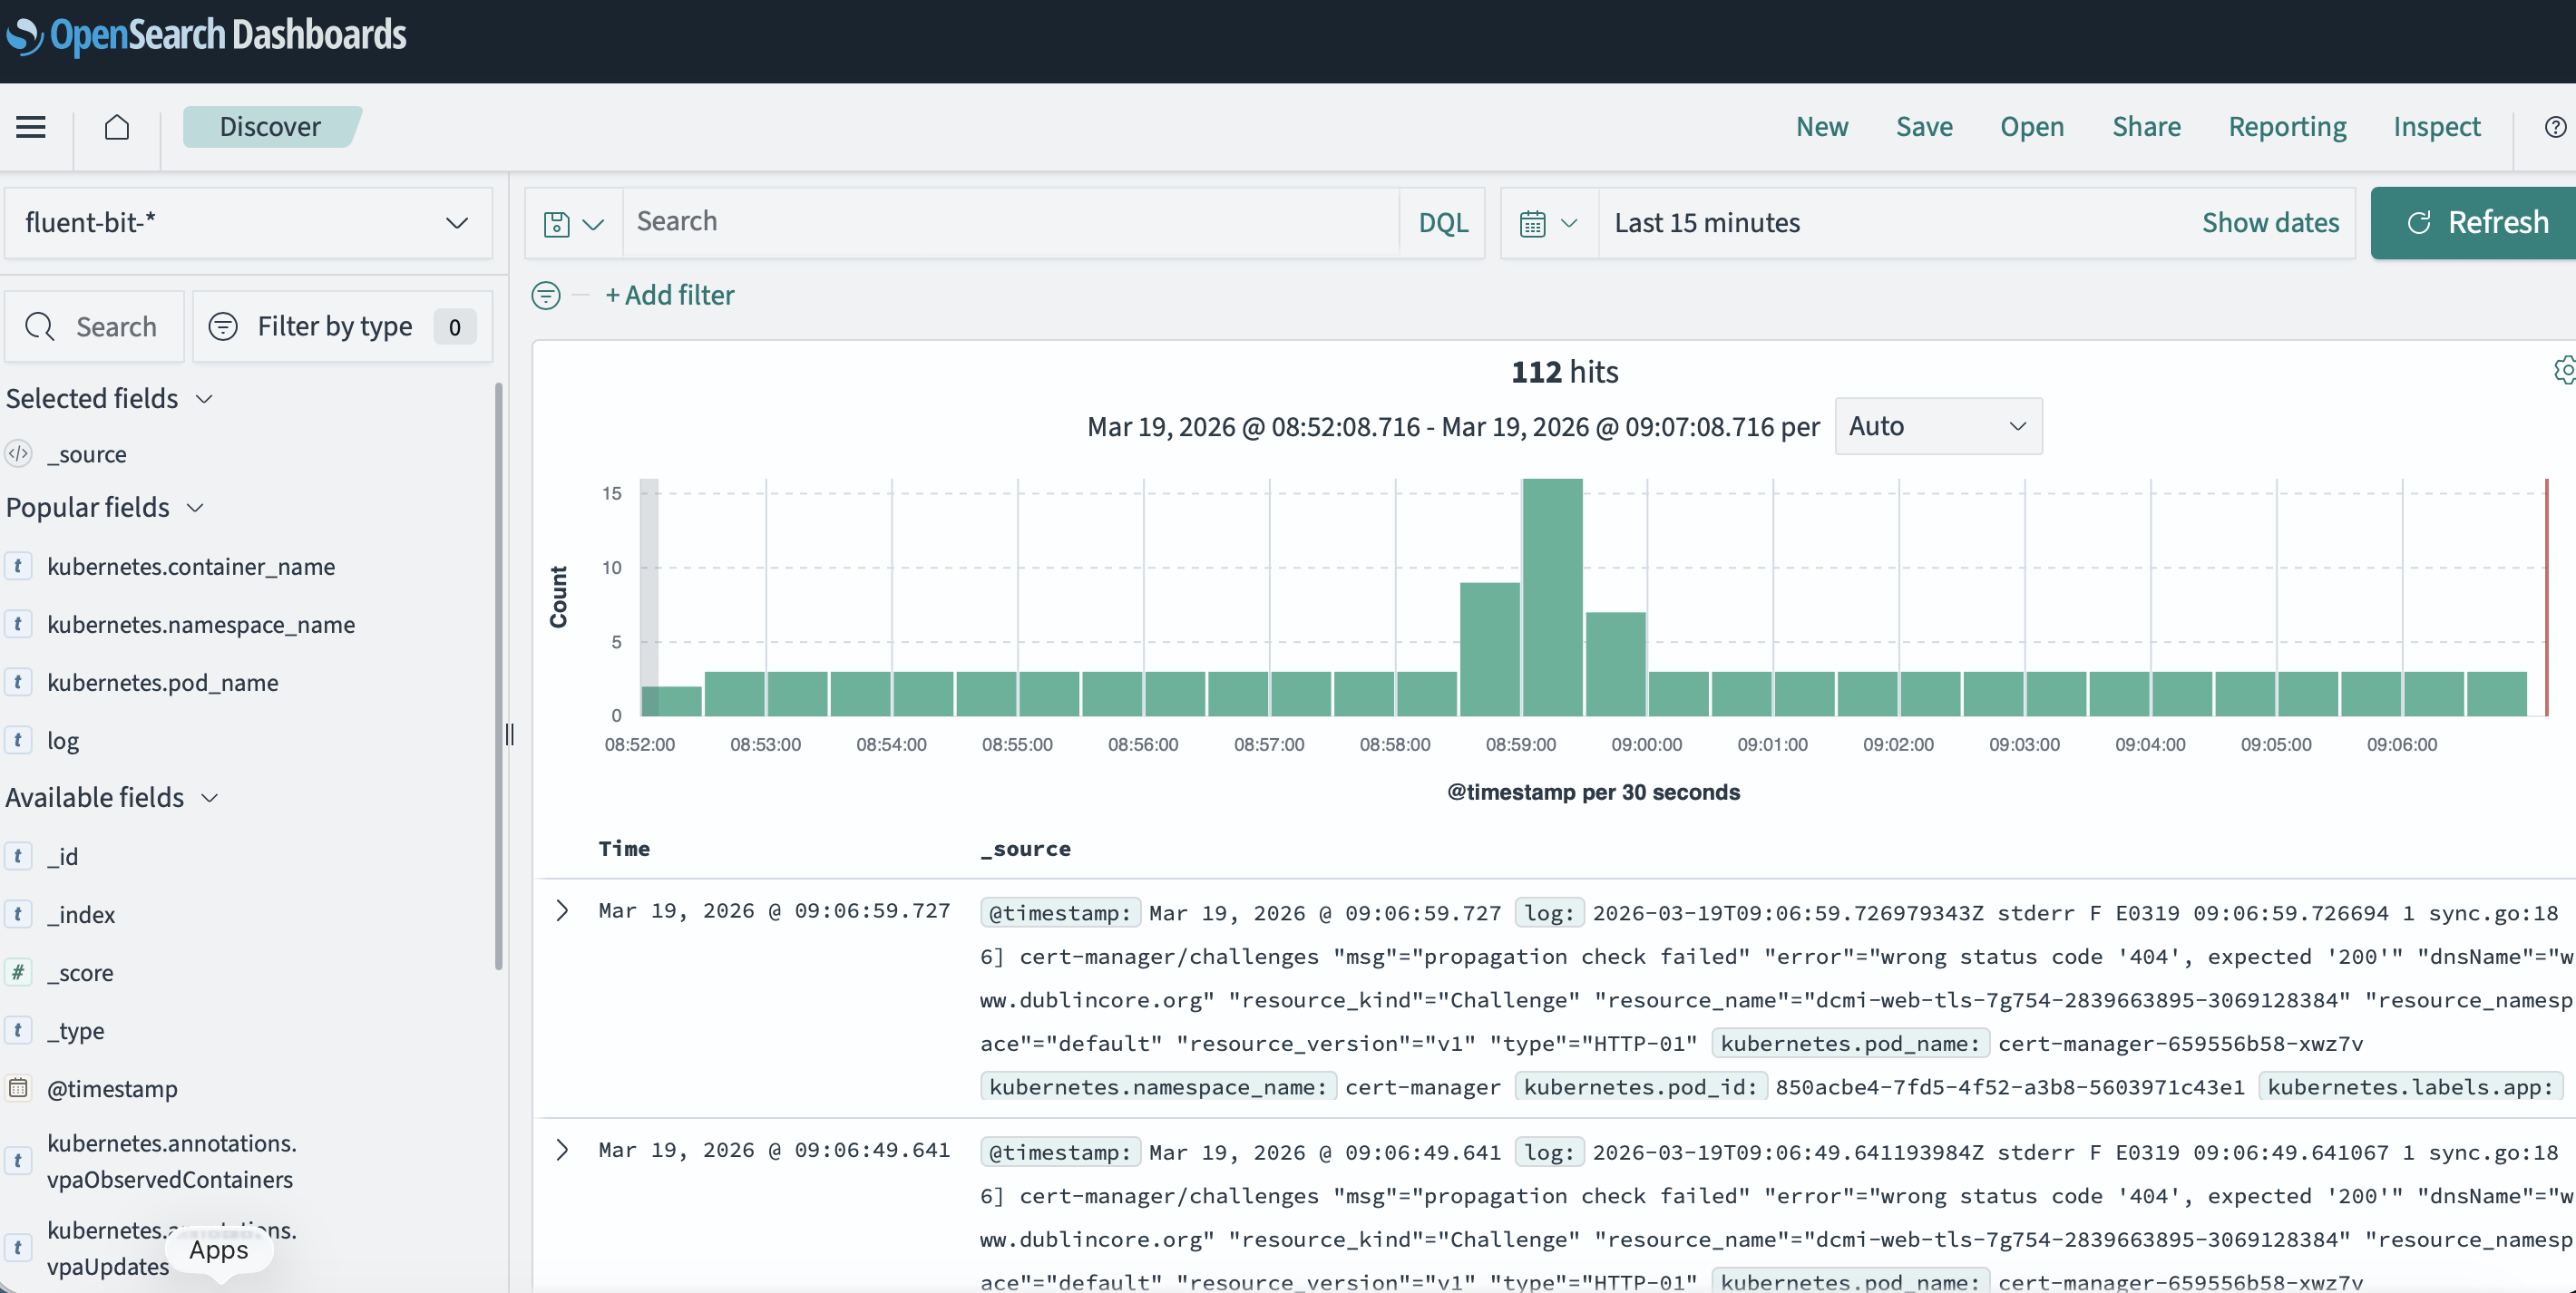
Explore Logs
Once you have created the index pattern, you can use the Discover tab in OpenSearch Dashboards to explore the logs. You can filter and search through the logs to find relevant information about errors and issues in your applications. You can also create visualizations and dashboards to monitor the health of your applications and quickly identify any problems.
Retention and Storage Considerations
When integrating Fluent Bit with OpenSearch, it's important to consider the retention and storage of your logs. OpenSearch can consume a significant amount of storage if logs are not properly managed. You may want to set up index lifecycle management policies in OpenSearch to automatically delete old logs after a certain period of time or when the index reaches a certain size. Additionally, you can configure Fluent Bit to only send relevant logs to OpenSearch, as shown in the configuration example above, to reduce the amount of data being indexed.
Example Index Lifecycle Management Policy
Here's an example of how to set up an index lifecycle management policy in OpenSearch to manage log retention:
{
  "policy": {
    "phases": {
      "hot": {
        "actions": {
          "rollover": {
            "max_size": "50GB",
            "max_age": "30d"
          }
        }
      },
      "delete": {
        "min_age": "90d",
        "actions": {
          "delete": {}
        }
      }
    }
  }
}
This policy will roll over the index when it reaches 50GB in size or is 30 days old, and it will delete indices that are older than 90 days. You can customize these values based on your specific needs and storage capacity.
Conclusion
By integrating Fluent Bit with OpenSearch and using OpenSearch Dashboards, we have a powerful and efficient log management solution that fits well with our existing infrastructure. This setup allows us to easily visualize and analyze our logs without the need for additional tools, making it a great choice for our Kubernetes environment on Linode.
Next Steps
- Explore how to exclude or baseline certain logs to further reduce noise in OpenSearch.
- Set up alerts in OpenSearch Dashboards to notify us of critical errors or issues in our applications.
- Consider implementing additional filters in Fluent Bit to further refine the logs being sent to OpenSearch
- Monitor the performance and resource usage of OpenSearch to ensure it can handle the volume of logs being indexed.